





Table Of Content
Introduction
The quality of software depends not only on its functionality but also on its performance, stability, and responsiveness under intensive usage conditions. In this context, load testing becomes a key pillar of software quality assurance, as it evaluates how an application behaves when the number of concurrent users or transactions increases. These tests enable performance optimization, scalability evaluation, and reliability verification under high-traffic scenarios, ultimately contributing to an improved user experience.
Detecting and resolving performance issues before deployment prevents costly failures in production and ensures more robust and efficient applications. In modern performance engineering, specialized tools such as Apache JMeter and Grafana K6 have become essential solutions: JMeter, a mature and highly customizable open-source tool, and K6, a modern JavaScript-based framework designed for seamless integration into CI/CD pipelines, both enable reproducible and continuous load testing focused on performance improvement.
This article explores the theoretical foundations of load testing and presents a comparative analysis between JMeter and K6, offering a practical guide to understanding how these tools can be applied to build reliable, high-performance systems capable of maintaining stability under demanding workloads
Keyphrases
- Load testing: Controlled simulation of concurrent users and real traffic to evaluate an application’s performance, stability, and responsiveness.
- Performance optimization: Analysis and improvement of technical and operational workflows to identify and eliminate bottlenecks that affect system efficiency, response time, and scalability under varying levels of load.
- Scalability assessment: Measurement of how the system responds to a progressive increase in users or simultaneous requests.
- Stability and reliability under load: Verification that the application maintains stable behavior during long periods of stress.
- K6 and JMeter in performance testing: Leading tools that enable automated and reproducible load tests across different environments.
- CI/CD integration: Automation of performance testing within the continuous development cycle to detect early degradations.
- User experience and latency: Perceptible improvement in response times that increases user satisfaction and retention.
Types of Performance Tests: Load, Stress, Spike, and Soak
Load, stress, spike, and soak tests are categories of performance testing aimed at evaluating a system’s capacity, stability, and resilience under different conditions. Load testing analyzes how software behaves under expected levels of usage; stress testing pushes it beyond its operational limits to determine its breaking point and recovery capacity; spike testing examines its response to sudden and extreme surges in traffic; and soak testing evaluates performance and resource consumption over extended periods of sustained load.
Together, these tests provide a comprehensive view of system performance, helping to identify bottlenecks, optimize resource utilization, and ensure a stable user experience even under critical conditions. This progressive relationship among test types is illustrated in Figure 1, which depicts the increasing intensity from Load → Stress → Spike → Soak testing.
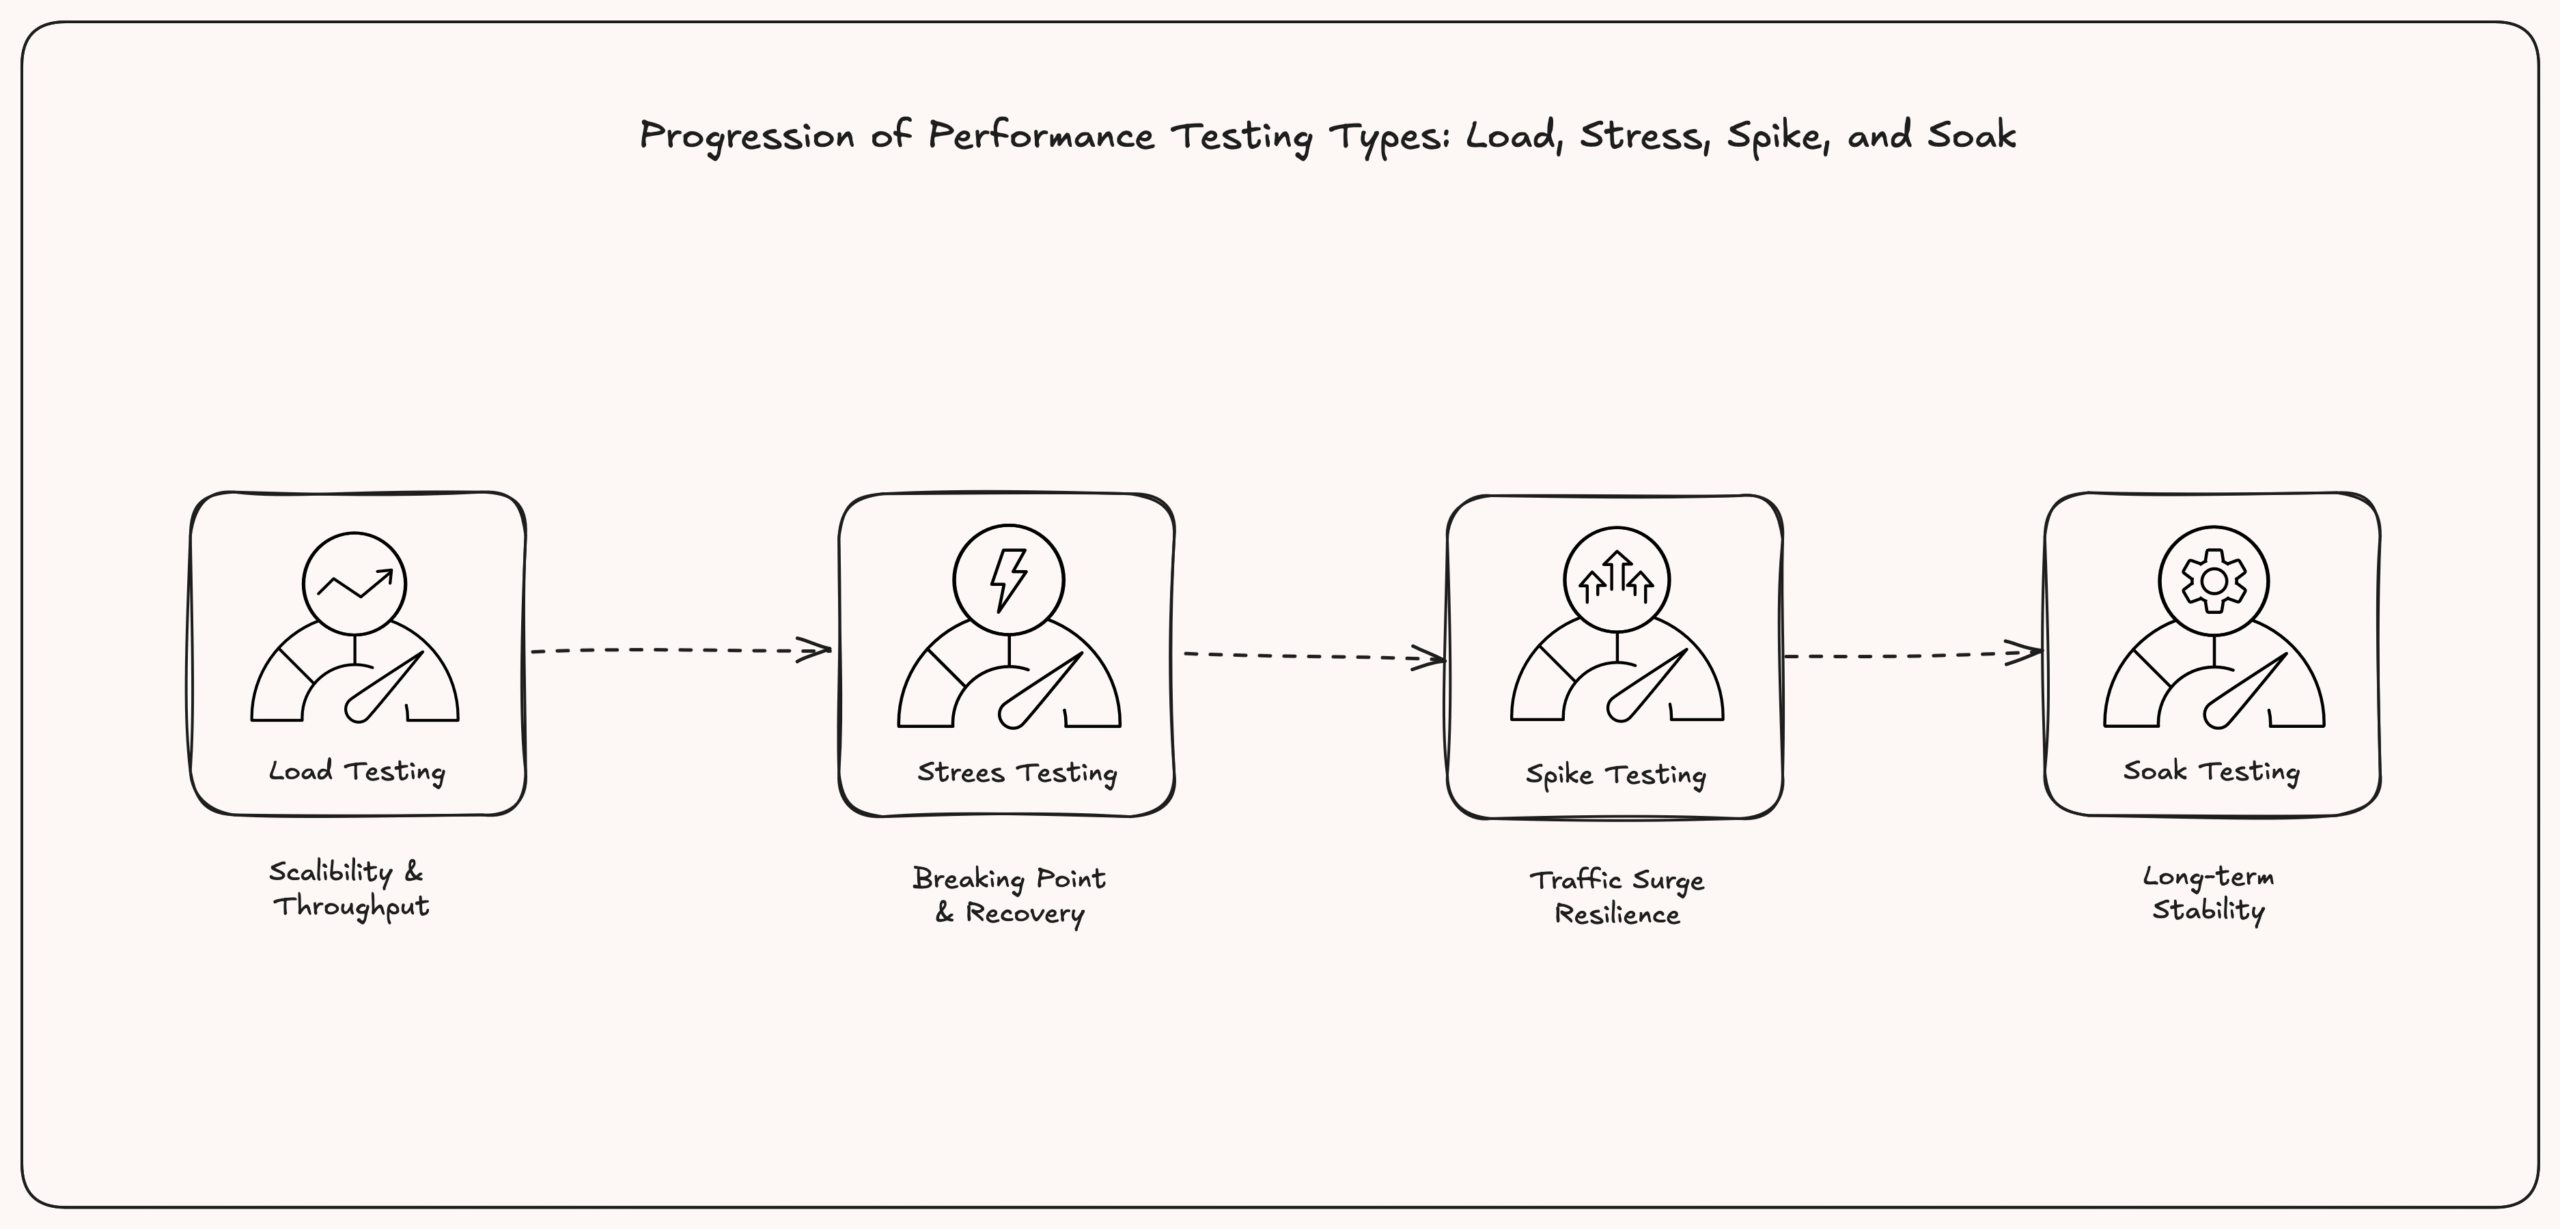
Figure 1. Progression of Performance Testing Types: Load, Stress, Spike, and Soak
Apache JMeter: Architecture and Functioning
Apache JMeter is one of the most recognized and long-standing tools in the field of performance testing. Developed by the Apache Software Foundation in 1998, it was initially designed to evaluate web applications but has since evolved into a versatile solution capable of executing load testing, stress testing, and functional testing across multiple protocols such as HTTP, SOAP, REST, FTP, JDBC, and JMS. This wide compatibility makes it a popular choice in enterprise environments where diverse systems and services coexist.
The tool is entirely developed in Java and employs a thread-based model to simulate concurrent users. Its structure is organized through a Test Plan, which groups different Thread Groups, Samplers (actions executed by virtual users), and additional elements such as controllers, assertions, or listeners to register results. This architecture facilitates load testing scenarios that support performance optimization, stability and reliability under load, and the evaluation of scalability across multiple layers of the system. As illustrated in Figure 2, JMeter’s execution flow covers all stages of a test: from defining virtual users to generating detailed performance reports. Test plans are stored in .jmx format (XML files) that can be easily versioned, allowing both visual creation through the GUI and automation via code or integration with CI/CD systems such as GitLab or Jenkins.
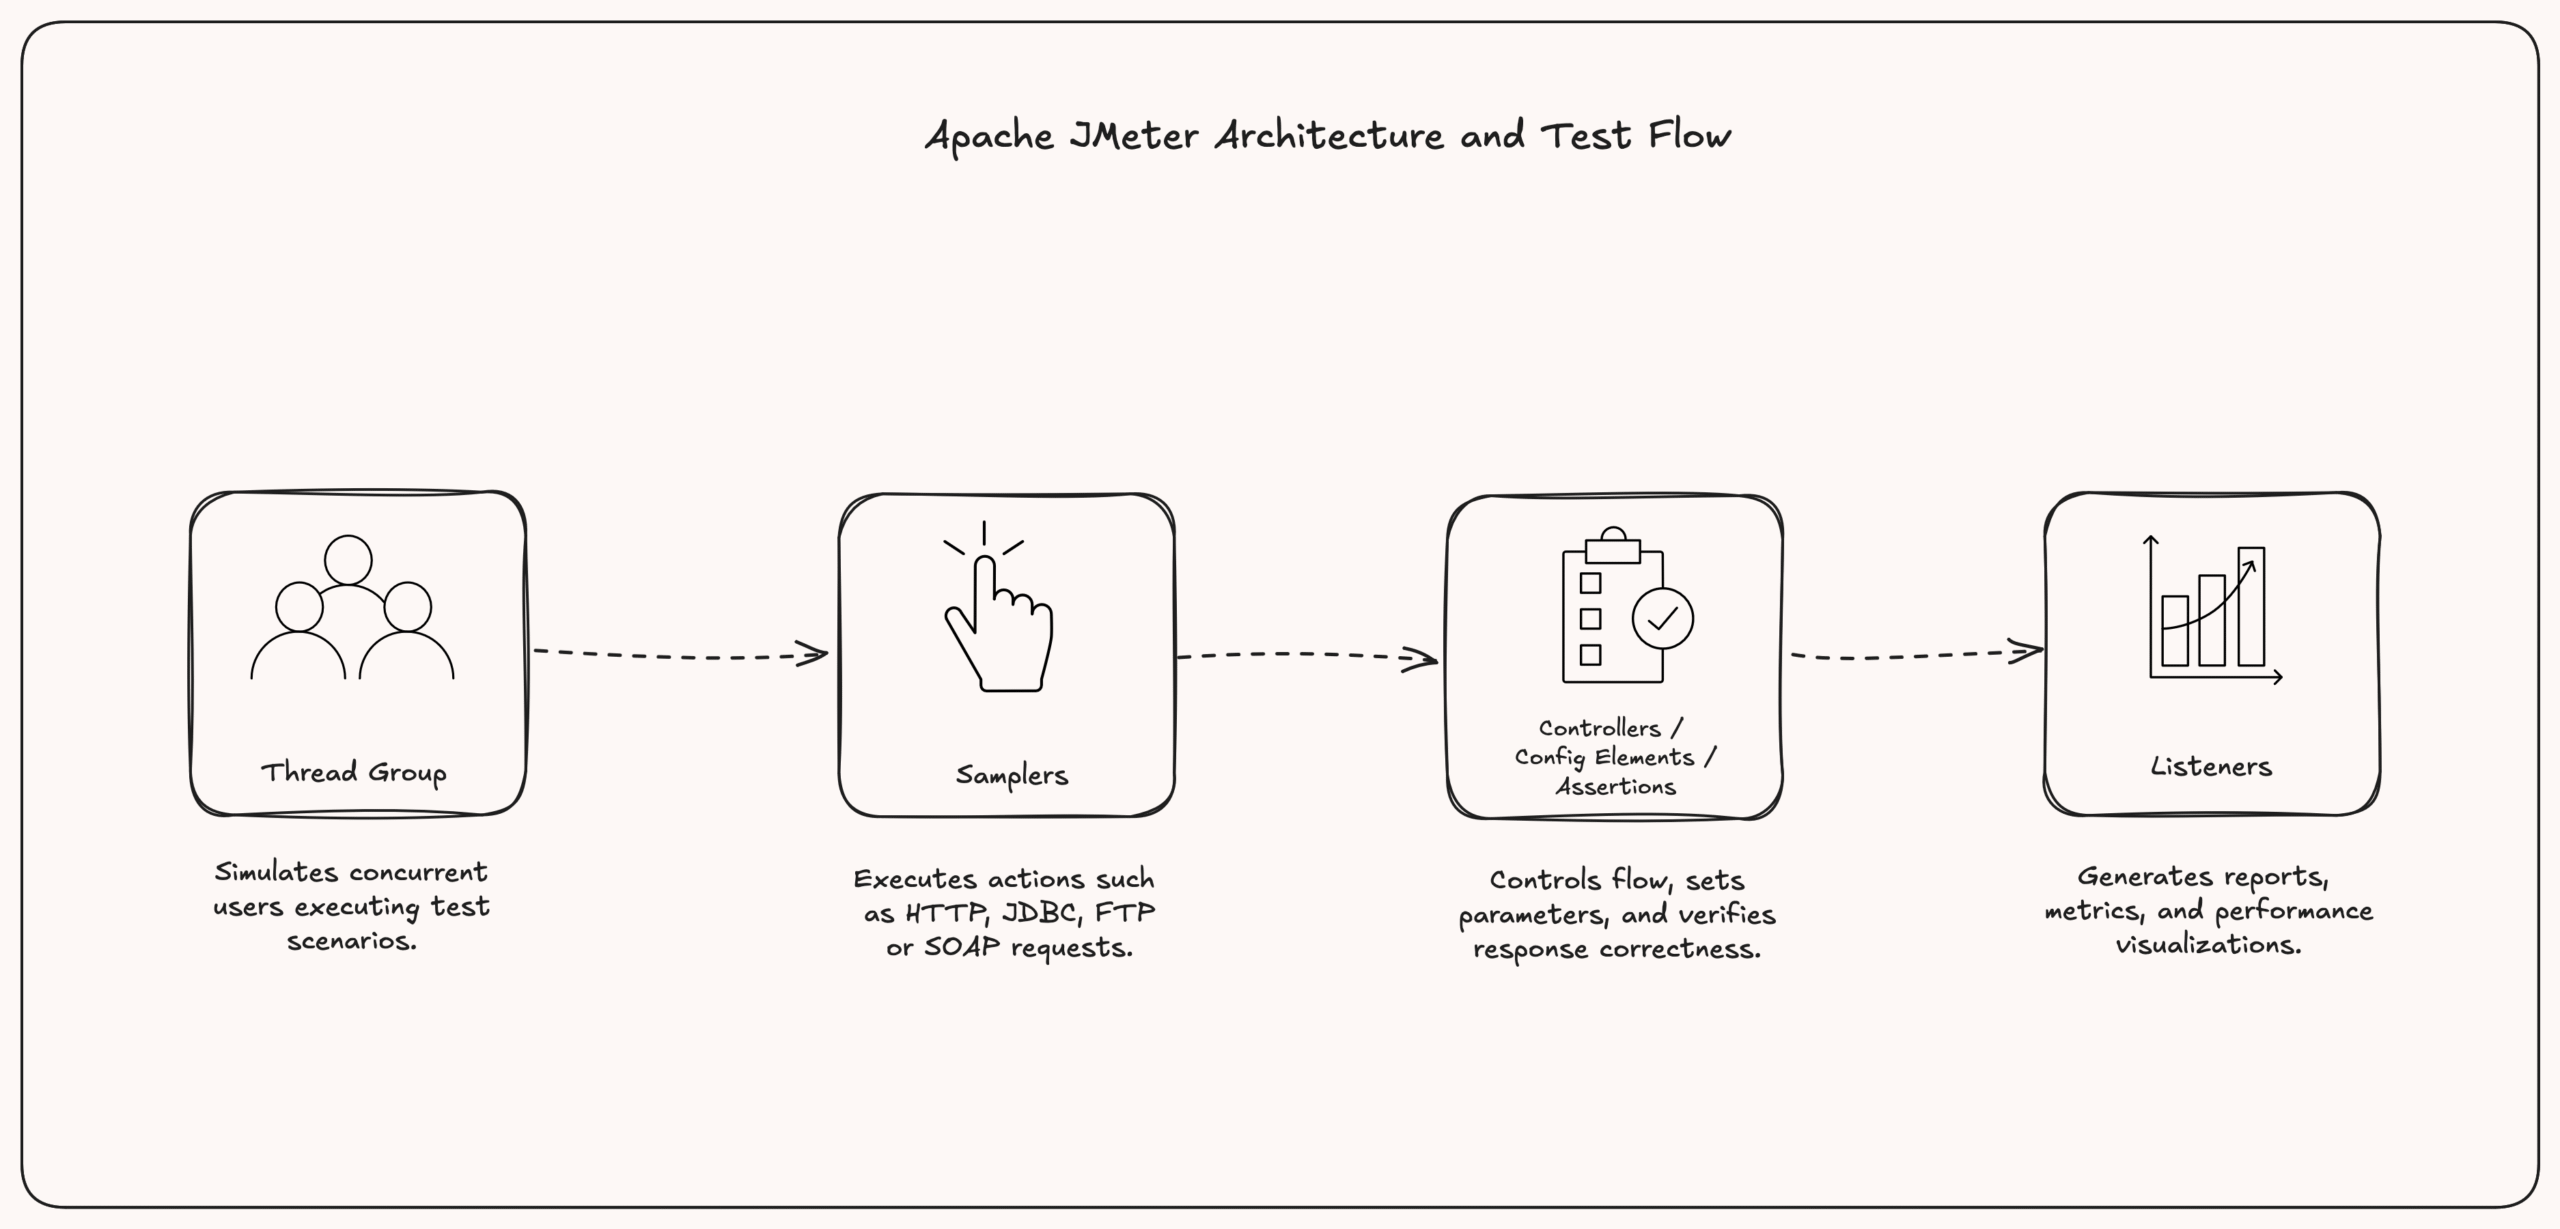
Figure 2. Apache JMeter Architecture and Test Flow
One of JMeter’s main advantages is its graphical user interface (GUI), which simplifies the design of load testing scenarios without the need for programming. This accessibility allows testers with varying levels of experience to build and execute tests visually and intuitively, using features like record & playback to simulate real user behavior. Through this approach, JMeter enables teams to analyze user experience and latency, detect bottlenecks, and support performance optimization initiatives efficiently.
Additionally, JMeter offers strong extensibility through its large ecosystem of plugins and scripting support in Groovy, JavaScript, and Python, allowing the customization of advanced test logic and integrations. Its ability to run both in GUI and non-interactive mode (CLI) makes it ideal for integration with CI/CD pipelines, facilitating automation and continuous testing with tools like GitLab CI or Taurus. For high-volume tests, JMeter also supports distributed execution across multiple nodes or via cloud platforms such as BlazeMeter or Flood, enabling comprehensive evaluation of scalability under real-world load conditions.
Thanks to its maturity, extensive documentation, and a large community of users, Apache JMeter remains a reference standard in performance testing. Although its Java-based architecture may demand higher CPU and memory usage compared to lighter alternatives, it continues to be a core tool for teams focused on performance optimization, stability and reliability under load, and the continuous improvement of user experience and latency in demanding environments.
Grafana K6: Architecture and Functioning
Grafana K6 (formerly known simply as K6) is a modern tool for load testing and performance optimization, launched in 2017 and currently maintained by Grafana Labs. Unlike traditional solutions, K6 follows a code-first approach, where tests are defined through scripts written in modern JavaScript, allowing them to be treated as part of the project’s source code. This paradigm facilitates integration with CI/CD workflows, transforming performance testing into an automated, version-controlled, and continuous process within the development cycle.
Developed in Go (Golang), K6 stands out for its efficiency and low resource consumption. Its engine leverages Go’s lightweight goroutines instead of system threads, enabling the simulation of tens of thousands of virtual users on a single machine. Each virtual user independently executes the actions defined in the script through an embedded JavaScript engine (Goja), without relying on Node.js or external interpreters. This architecture enables highly efficient load testing and supports evaluation of scalability under large volumes of concurrent traffic with minimal system overhead.
K6 scripts, written in JavaScript or TypeScript, model realistic user behavior and include programming logic to represent real-world flows. A typical test structure includes configuration options, a main function executed by virtual users, and optional setup and teardown phases. K6 supports multiple execution models, from constant user loads to arrival-rate–based traffic, enabling realistic performance optimization and stability and reliability under load assessments. Complex scenarios, such as ramp-ups, spikes, or variable patterns, can also be defined, along with browser-level tests through the experimental xk6-browser extension.
Designed for DevOps and cloud-native environments, K6 is fully CLI-based (no graphical interface), easy to install, and portable through binaries or Docker containers. Its integration into automation pipelines is straightforward: running K6 run script.js launches a test immediately. Moreover, K6 allows defining thresholds that determine success or failure based on performance metrics, making it possible to automatically reject builds that fail to meet requirements. This makes it ideal for integration with CI/CD and continuous validation of system performance. As shown in Figure 3, K6 integrates seamlessly with real-time monitoring tools such as Grafana, InfluxDB, Prometheus, or Datadog, allowing teams to visualize user experience and latency, system stability, and performance optimization in a unified dashboard.
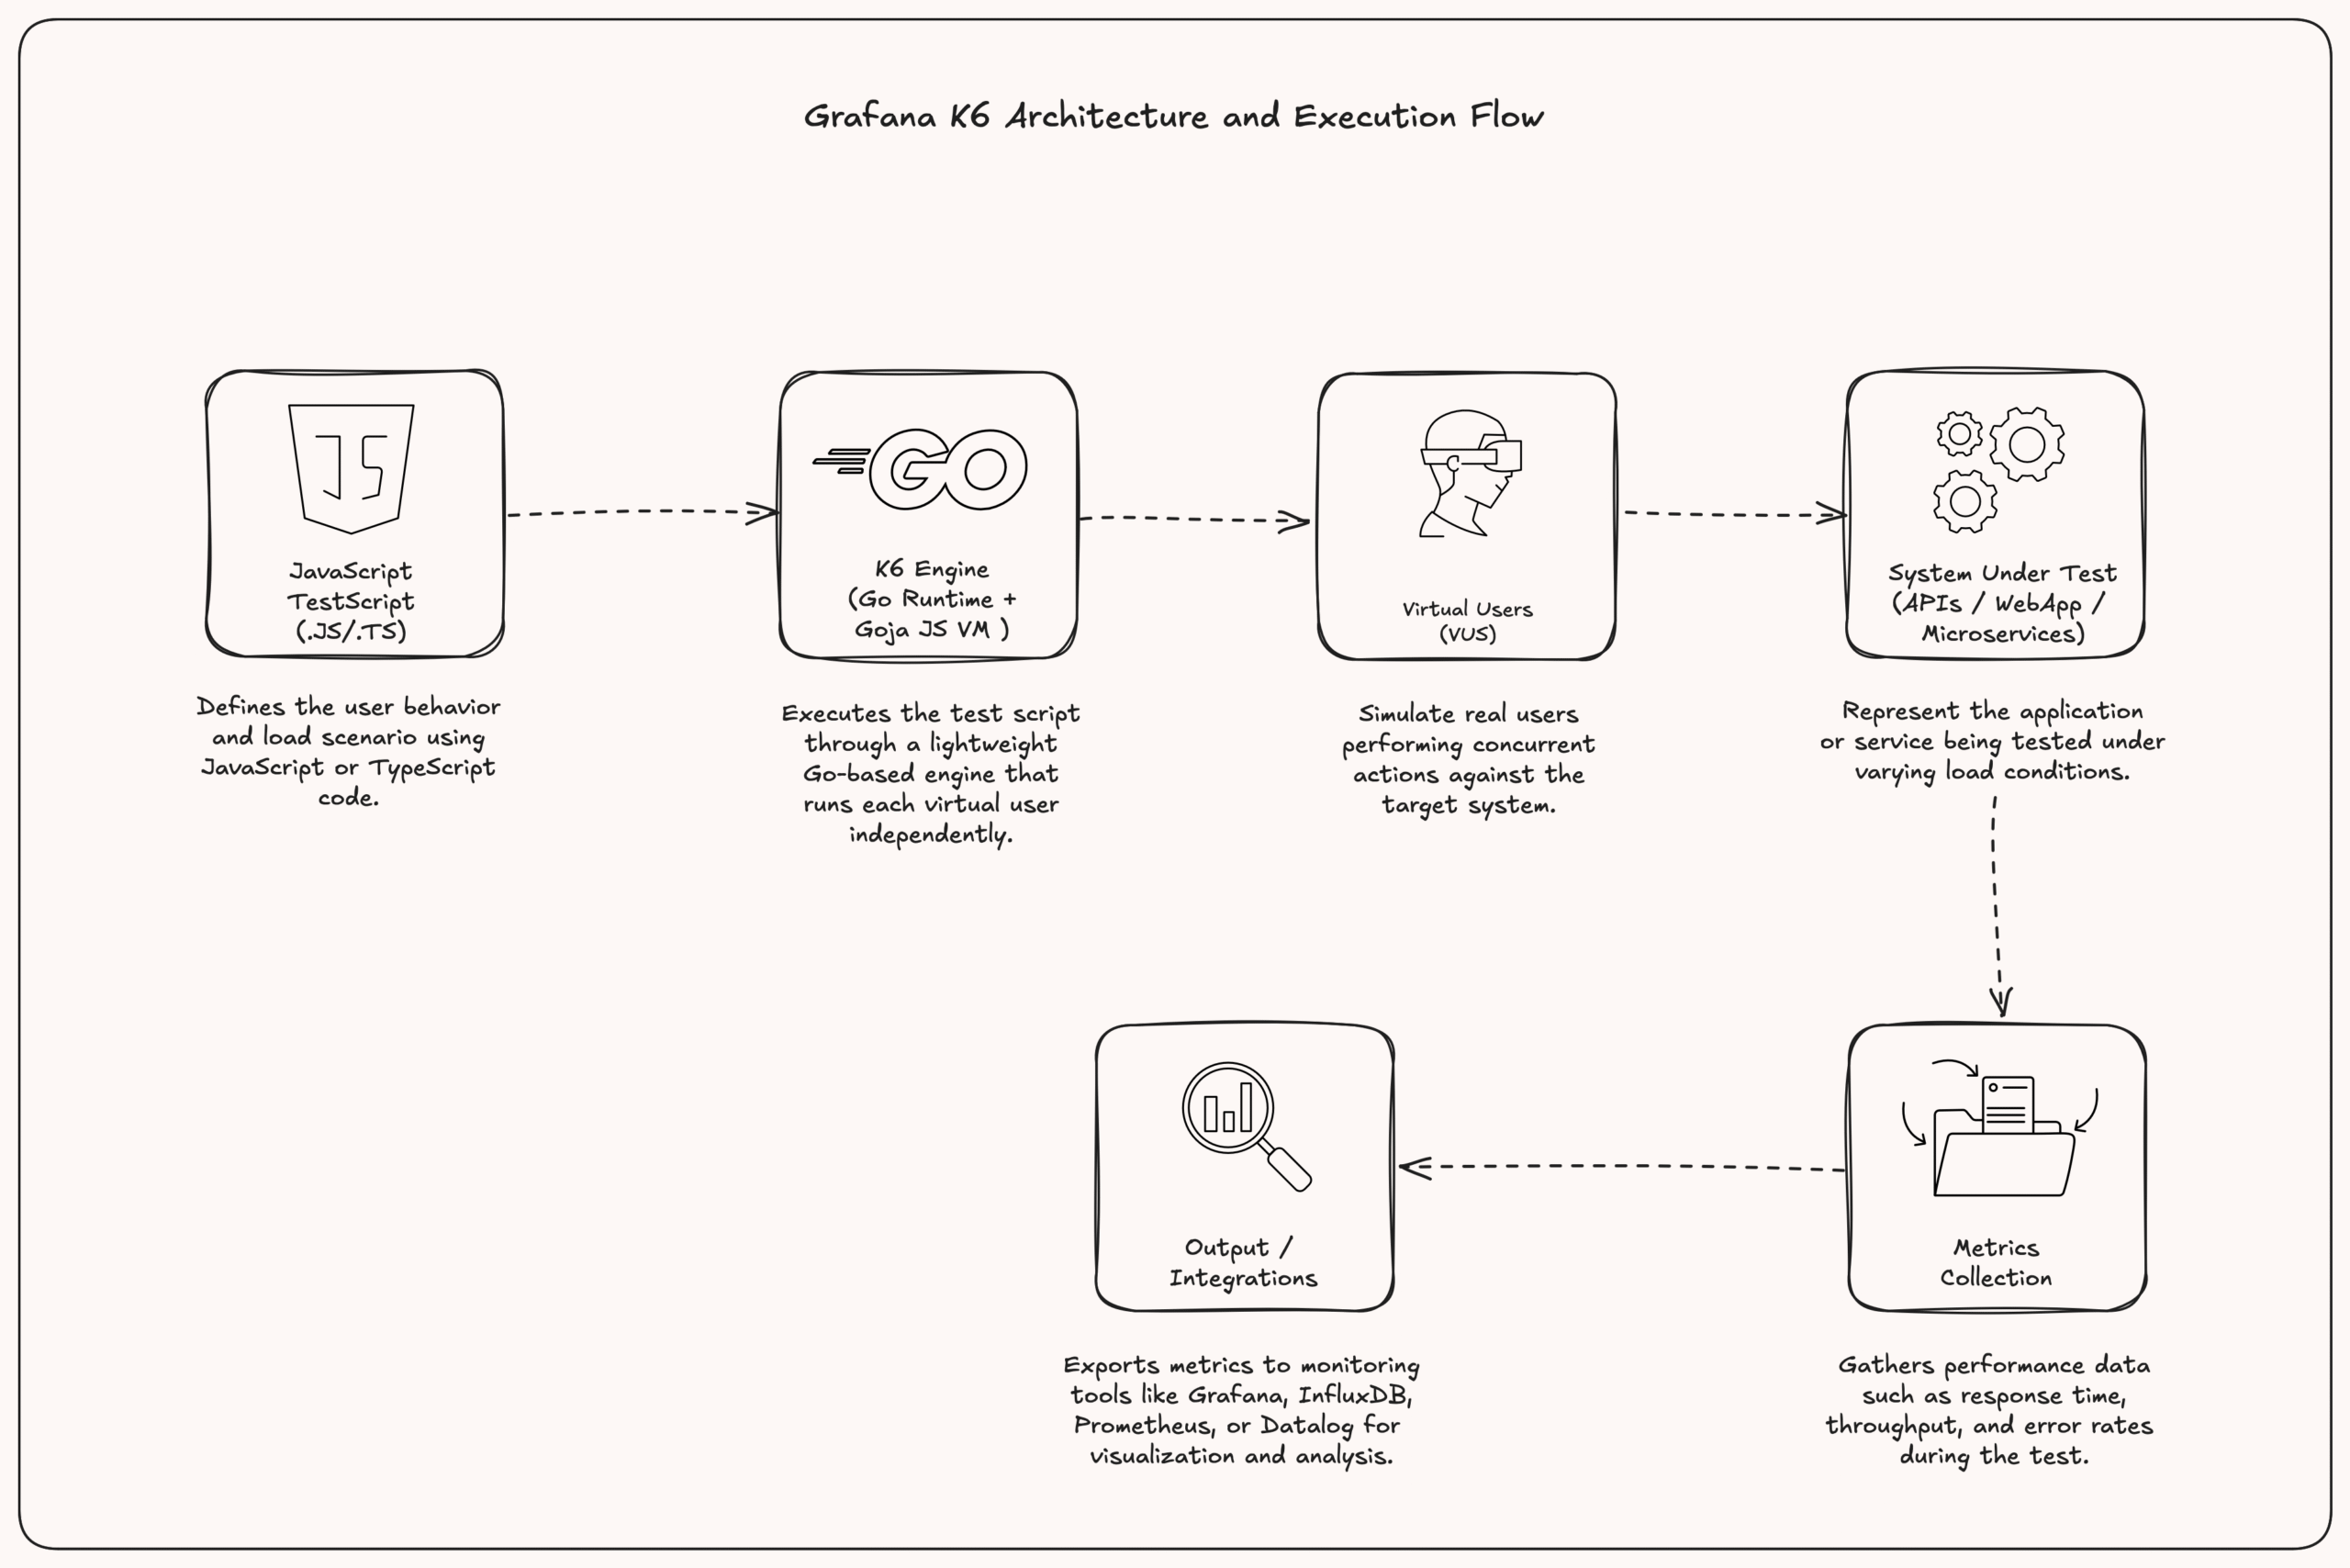
Figure 3. Grafana K6 Architecture and Execution Flow
Thanks to its lightness, flexibility, and modern design, Grafana K6 has become a preferred tool for development teams focused on building scalable, efficient, and resilient systems. Although it supports fewer protocols than JMeter, its native efficiency, ease of automation, and compatibility with observability platforms make it a powerful choice for evaluation of scalability, stability and reliability under load, and continuous performance optimization in cloud and API-driven applications.
Comparison between Grafana K6 and Apache JMeter
Both Grafana K6 and Apache JMeter are powerful tools for load testing and performance optimization, though they differ significantly in philosophy, architecture, and target audience. While JMeter represents a mature, GUI-based, and highly extensible solution, K6 embodies a modern, lightweight approach aligned with the “performance as code” concept. The following comparison highlights their main differences and strengths.
Ease of Use and Interface
JMeter provides a graphical interface that simplifies test design, allowing users to create load testing scenarios visually through components and configuration panels. This makes it accessible for testers without programming experience. However, for complex tests, the GUI can become heavy, and advanced customization may require scripting in Groovy or BeanShell. K6, on the other hand, has no GUI and operates entirely from the command line. Tests are defined in JavaScript, which requires technical knowledge but provides greater flexibility, modularity, and maintainability. In summary, JMeter is more beginner-friendly, while K6 scales better for complex automation and integration with CI/CD workflows.
Scripting Language and Test Model
In JMeter, tests are typically configured through XML-based .jmx files generated from the GUI, which simplifies initial setup but limits dynamic programming. For advanced logic, it supports scripting with Groovy, JavaScript, or Python via JSR223 components. K6, conversely, defines tests entirely as JavaScript/TypeScript code, allowing full use of loops, conditions, and reusable functions. This approach makes it easier to create realistic load testing scenarios and perform detailed evaluation of scalability and stability and reliability under load through code that can be versioned and reused.
Supported Protocols
JMeter supports a wide variety of protocols, HTTP, JDBC, JMS, FTP, SMTP, LDAP, TCP, among others, making it ideal for heterogeneous enterprise environments, particularly in contexts that require robust Enterprise Application Integration (EAI) strategies to ensure interoperability between systems. K6 focuses on web and API-first systems, supporting HTTP, HTTPS, WebSocket, and gRPC (via extensions). While less diverse, this focus aligns perfectly with modern applications and microservice architectures.
Performance, Scalability, and Resource Consumption
K6 clearly stands out in evaluation of scalability and efficiency. Its Go-based engine and lightweight goroutines allow the simulation of thousands of virtual users with minimal CPU and memory usage. In contrast, JMeter, based on Java threads, consumes more resources and often requires distributed execution earlier. K6 integrates natively with Docker, Kubernetes (K6 Operator), and K6 Cloud, simplifying distributed and large-scale execution. JMeter also supports distributed tests, but configuration is more manual and less suited for dynamic, cloud-native environments.
Reporting, Monitoring, and CI/CD Integration
JMeter includes built-in reporting tools such as dashboards, listeners, and HTML summaries for immediate analysis after execution, supporting quick performance optimization and stability and reliability under load validation. K6 follows an observability-oriented philosophy: it exports metrics to Grafana, InfluxDB, Prometheus, or Datadog for real-time dashboards. This integration enhances user experience and latency tracking and enables continuous monitoring. For integration with CI/CD, K6 is natively compatible, allowing automated pass/fail decisions through thresholds. JMeter can also be automated via CLI or Jenkins plugins, but its XML-based configuration is less convenient for version control.
Community and Use Cases
JMeter, with over two decades of history, has a vast community, extensive documentation, and a large ecosystem of plugins, making it reliable for organizations requiring multi-protocol load testing and long-term performance optimization. K6, though newer, has grown rapidly under Grafana Labs’ support and is favored by DevOps teams for stability and reliability under load and modern integration with CI/CD pipelines in API-driven systems.
Practical Applications in Real Scenarios
In real-world contexts, load testing and performance optimization are vital to ensure software reliability and efficiency under varying conditions. E-commerce platforms prepare for peak seasons such as Black Friday or Cyber Monday by running load testing and spike tests to confirm stability and reliability under load. Ticketing and streaming services perform stress, spike, and soak tests to validate payment flows, streaming continuity, and user experience and latency under heavy traffic. Financial systems and online banking rely on evaluation of scalability to guarantee responsiveness during high-volume transaction periods, while government and educational portals use load testing to maintain availability during tax or enrollment deadlines. In modern cloud-native environments, companies integrate Grafana K6 and JMeter into CI/CD pipelines to automate load testing, ensuring ongoing performance optimization and continuous evaluation of scalability. Altogether, these practices safeguard system resilience and deliver a consistent user experience and latency, preventing failures before they impact end users.
Conclusion
Load testing plays a fundamental role in modern software quality assurance. By applying complementary approaches such as stress, spike, and soak testing, teams can thoroughly assess stability and reliability under load and system behavior under varying demands. Tools like Apache JMeter and Grafana K6 enable the design of automated, reproducible, and continuous performance evaluations, supporting evaluation of scalability, performance optimization, and integration with CI/CD workflows. Ultimately, mastering these techniques ensures that applications are not only functional but also efficient, stable, and responsive, delivering a superior user experience and latency under any level of demand.